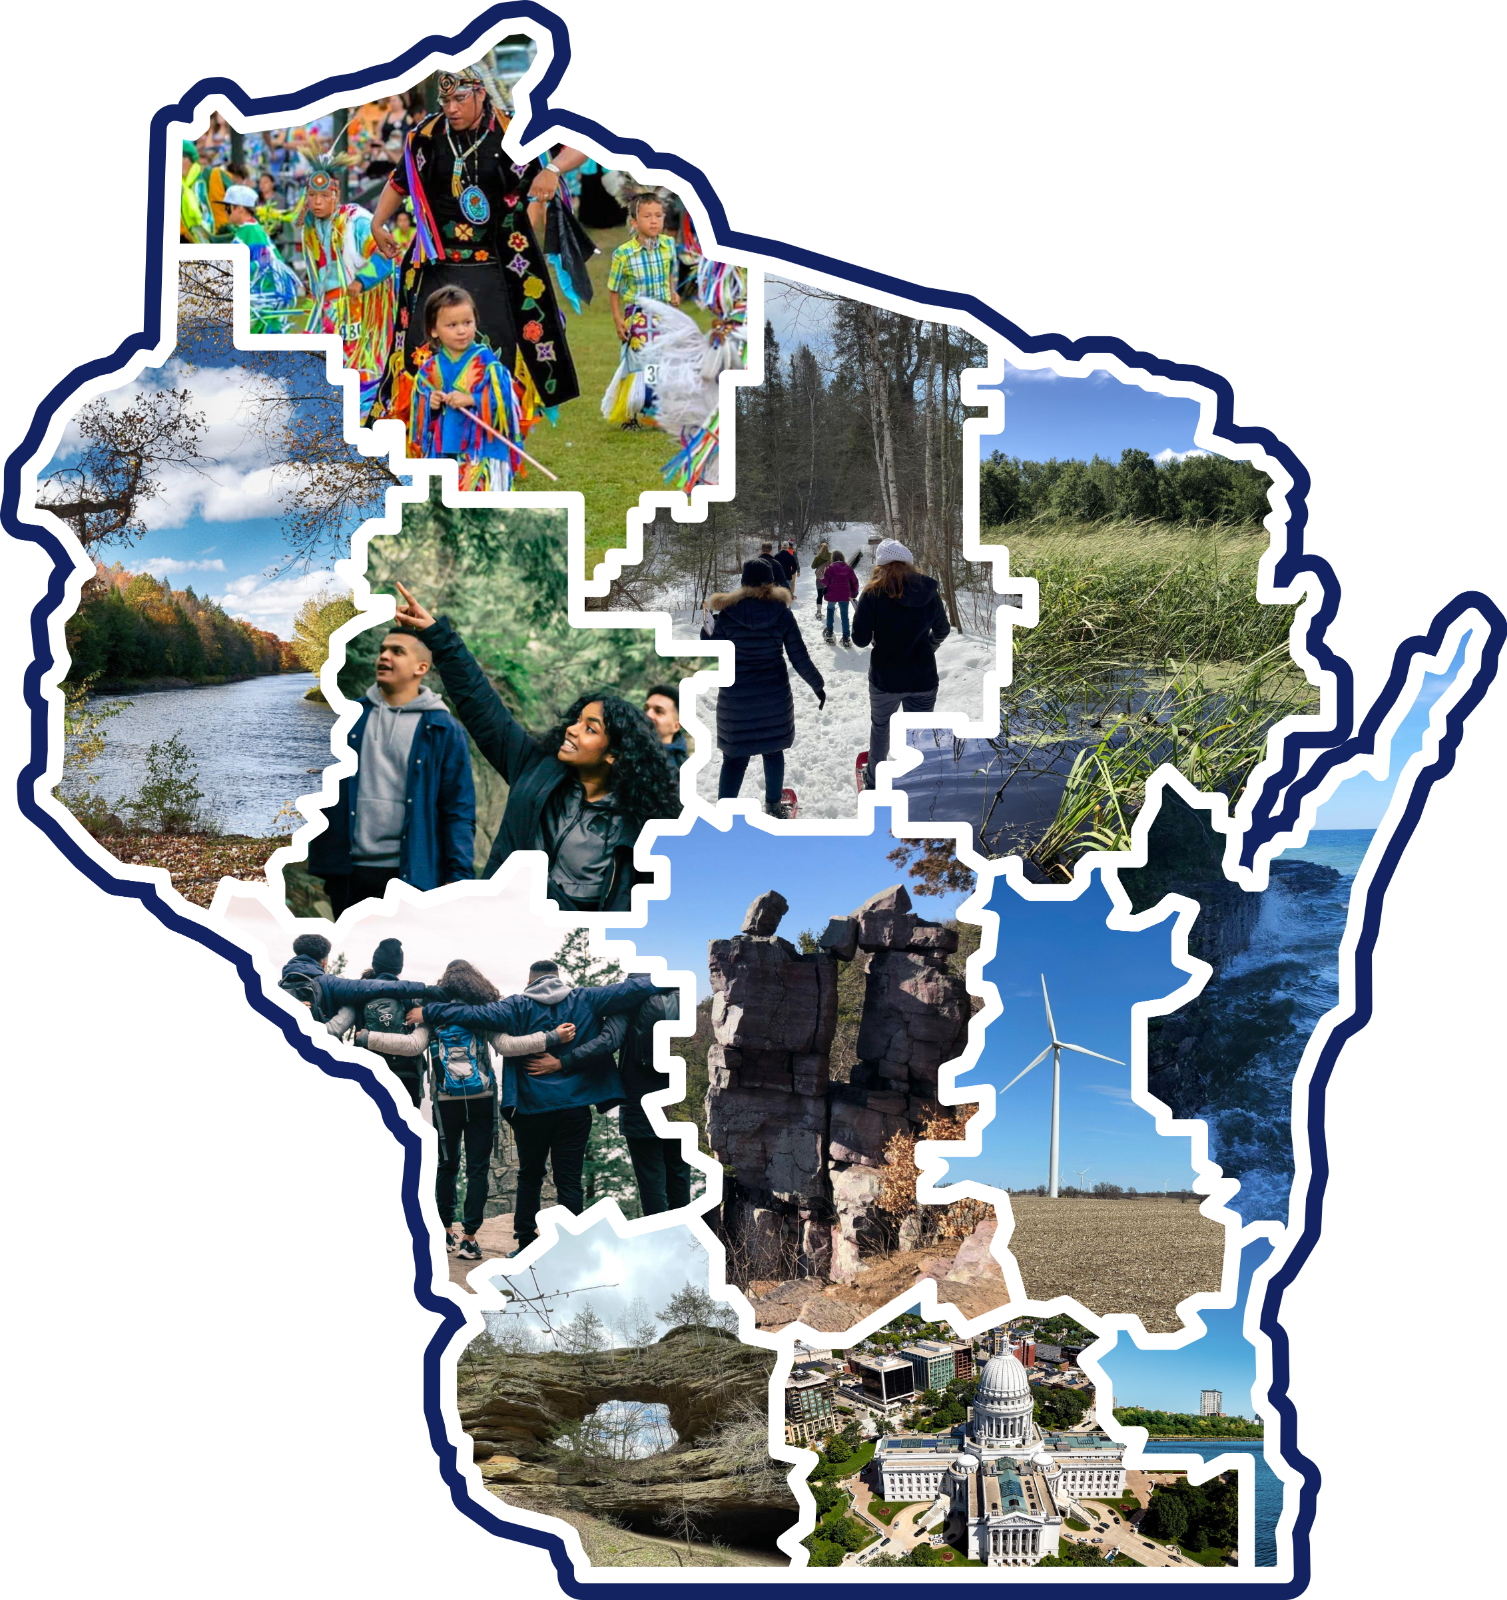

Visualizing Flooding in Green Bay
Grades: 9, 10, 11, 12, AP
Type: Articles/Websites
Subjects: Earth and Space Sciences, History, Engineering
Authors: NOAA
Location: North America, North America > United States, North America > United States > Michigan, North America > United States > Wisconsin

This resource has been reviewed by SubjectToClimate's climate scientists and verified for scientific accuracy and up-to-date information. Learn about our review process →
This resource has been reviewed by SubjectToClimate's climate scientists and verified for scientific accuracy and up-to-date information. Learn about our review process →
Synopsis
- This article explores the nor'easter that ravaged Green Bay in April 1973, the nature of coastal floods, and the tools that can be used to convey flooding risks to coastal communities.
- Students will learn about tools like CanVis and the Great Lakes Water Level Dashboard, which can help coastal managers, engineers, and citizens assess risk and plan for potential flooding dangers.
Teaching Materials
Positives
- The Great Lakes Water Level Dashboard was created by NOAA and the Army Corps of Engineers.
- This article has two maps of Green Bay.
Additional Prerequisites
- Students should have a basic understanding of climate change and how it relates to flooding.
- Students need to know the following words: nor'easter, inundated, adjacent, erosion, infrastructure, and sustainability.
Differentiation
- This article could support a classroom discussion on why climate change may, in the future, cause emigration from coastal areas.
- This article could enhance a classroom discussion on how climate change affects infrastructure and why this matters.
- This article could augment a classroom discussion on how governments could employ climate change adaptation strategies.
- Engineering and science classes could use this article to connect to STEM career conversations, the need for new evaluations of flooding risk in coastal areas, and the ways that models and projections can be used to design safer and more resilient communities.
This resource from the U.S. Climate Resilience Toolkit describes visualization tools developed to help planners and property owners see potential flooding in Green Bay, Wisconsin. An April 1973 flood caused by a powerful nor’easter shows the risks of coastal flooding and the need for better ways to communicate flood risk. Visualization tools are introduced such as the Lake Level Viewer, which shows flooding extent on a map, and CanVis, which gives property owners a visual of what a flood event would look like at their property. Both can be found via links on the right hand side of the page, allowing students to see potential impacts across the Great Lakes. This resource shows how complicated hydrologic data can be expressed in a form that is useful for the layperson to aid them in building communities that are resilient to a changing climate. This is recommended for teaching.
Teaching Tips
Standards
Resource Type and Format
Scientist Reviewed
This resource has been reviewed by SubjectToClimate's climate scientists and verified for scientific accuracy and up-to-date information. Our review process ensures that every resource in our library reflects the current state of climate science.
Learn about our review process →