
"Plotting Spruce History"
Provided by: Jill Pelto Gallery|Published on: February 1, 2024|Last updated: July 16, 2026
Grades: 6, 7, 8, 9, 10, 11, 12
Type: Data, Graphs, and Maps
Subjects: Biology, Visual and Performing Arts
Authors: Jill Pelto Gallery
Location: Europe, Polar Regions

This resource has been reviewed by SubjectToClimate's climate scientists and verified for scientific accuracy and up-to-date information. Learn about our review process →
This resource has been reviewed by SubjectToClimate's climate scientists and verified for scientific accuracy and up-to-date information. Learn about our review process →
Synopsis
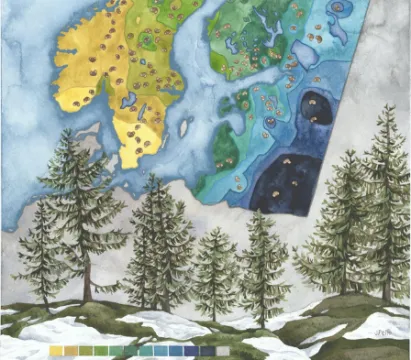
- In this watercolor and colored pencil piece, scientist and artist Jill Pelto depicts how the spruce tree has migrated through the northern European countries of Norway, Sweden, and Finland as ice has melted over the past 10,000 years.
- The artwork introduces data points in the form of pollen grains, which symbolize where sediment cores have been taken; each is a different color to represent what the data from the sediment cores revealed about where spruce trees have grown.
Teaching Materials
Positives
- This piece will show students the importance of reconstructing past climates so scientists understand how the environment responds to global warming.
- The data points and colors will help students visualize the migration and spread of the spruce tree through northern Europe as temperatures rose over the past several thousand years.
Additional Prerequisites
- Students should be familiar with scatter point data and how it visually represents information.
- Students should understand that human activity has contributed to rising temperatures.
Differentiation
- This resource works equally well in a science class, where students use the data to learn about changing habitats, or in an art classroom, where students can discuss the piece's structure and how people can convey information through art.
- Social studies or language arts classes can make cross-curricular connections by discussing different parts of the world and how they have changed through history or using art as a prompt for writing.
- This piece can be an inspiration piece for students to create their own artistic representation of data. Consider using data about habitat changes near you or another concept your class is working on.
- As an extension, have students use the data to predict the future migration of spruce trees.
This is a resource containing the artwork of a scientist that studies climate change. This resource could be helpful in explaining that art also conveys a message and how through art knowledge can be passed on. This resource is recommended for teaching.
Teaching Tips
Standards
Resource Type and Format
Scientist Reviewed
This resource has been reviewed by SubjectToClimate's climate scientists and verified for scientific accuracy and up-to-date information. Our review process ensures that every resource in our library reflects the current state of climate science.
Learn about our review process →